
Power BI empowers you to transform raw data into clear and insightful reports. This guide unveils the magic behind Power BI’s three key functionalities: Power Query, Power Pivot, and Power View. Follow along to learn how to extract, transform, and visualize your data like a pro.
1. Power Query: Transforming Your Data Canvas
Think of Power Query as your data architect. Here’s how to get started:
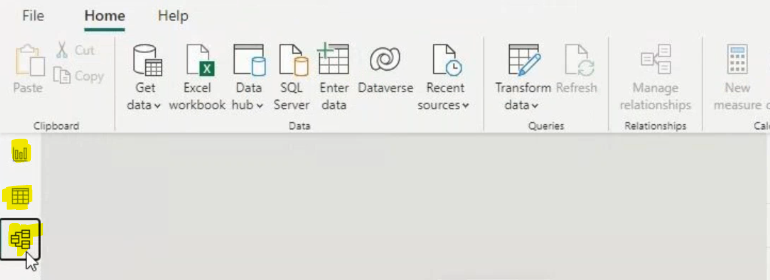
- Login to Power BI Desktop: Fire up the Power BI application and access the Power Query Editor.
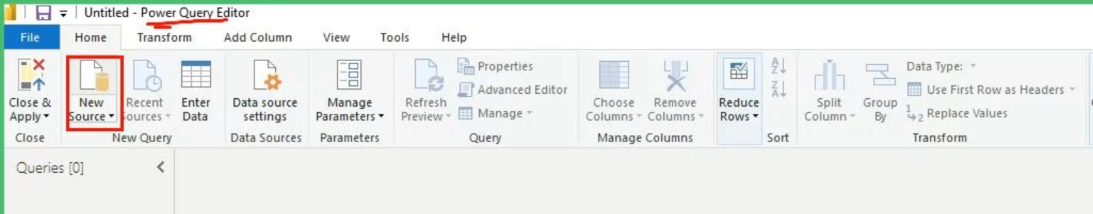
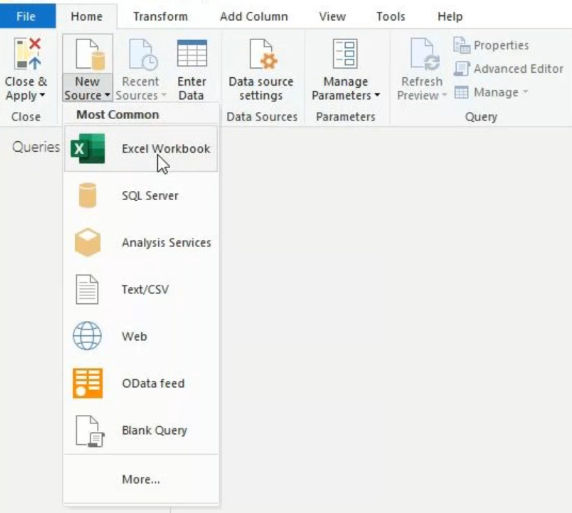
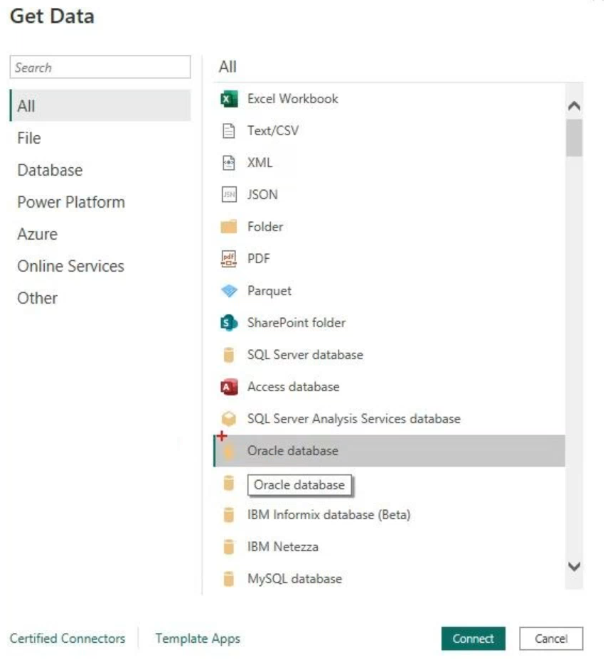
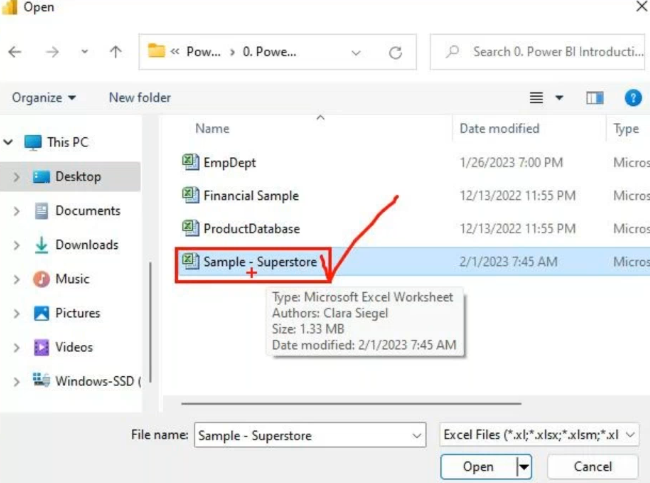
- Extract Your Data: Click “New Source” and explore the treasure trove of options – Excel, SQL Server, Web, and more!
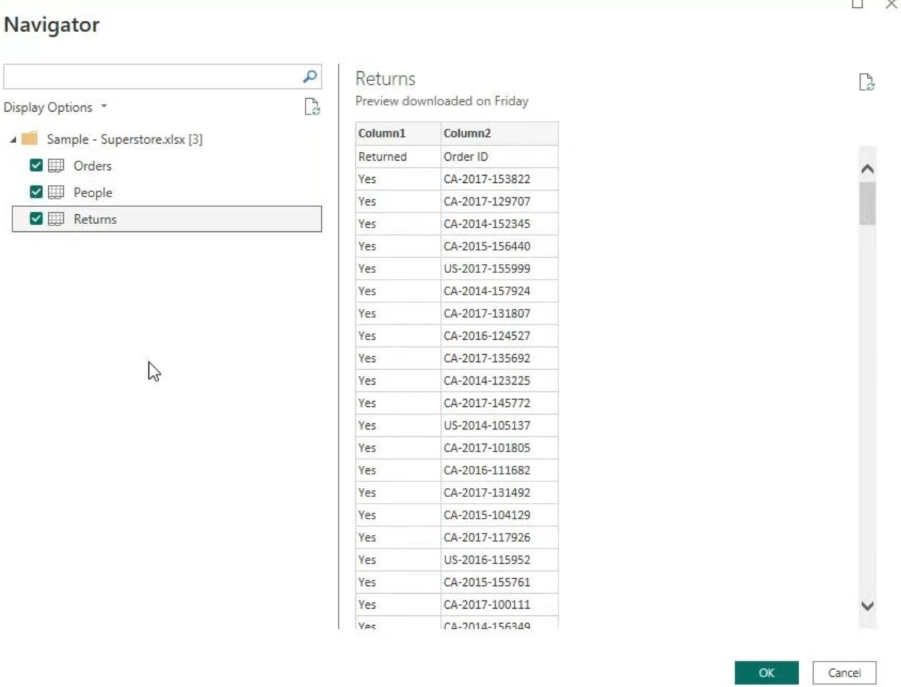
- Connect and Refine: Select the appropriate connector (e.g., Excel as shown in above image) and browse to your desired spreadsheet. Choose the relevant tables and click “Open.”
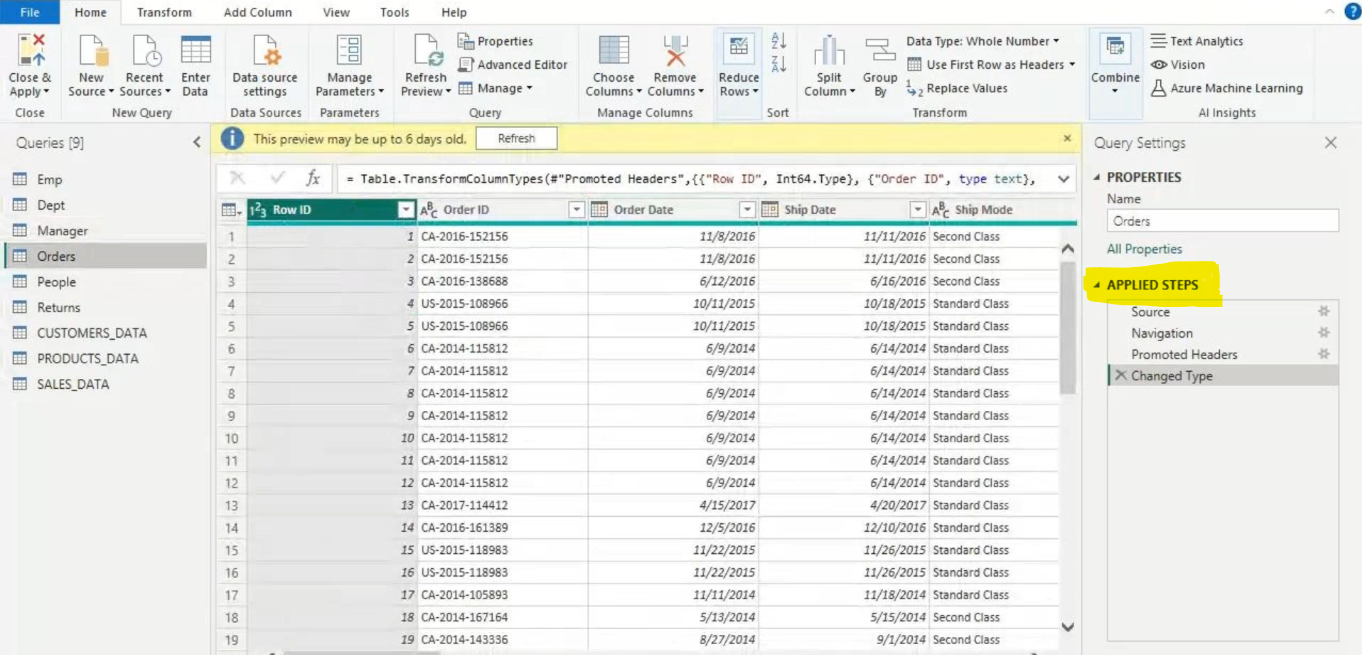
- Power Query Editor: You’ll see the tables within the Power Query Editor. Here’s where the magic happens!
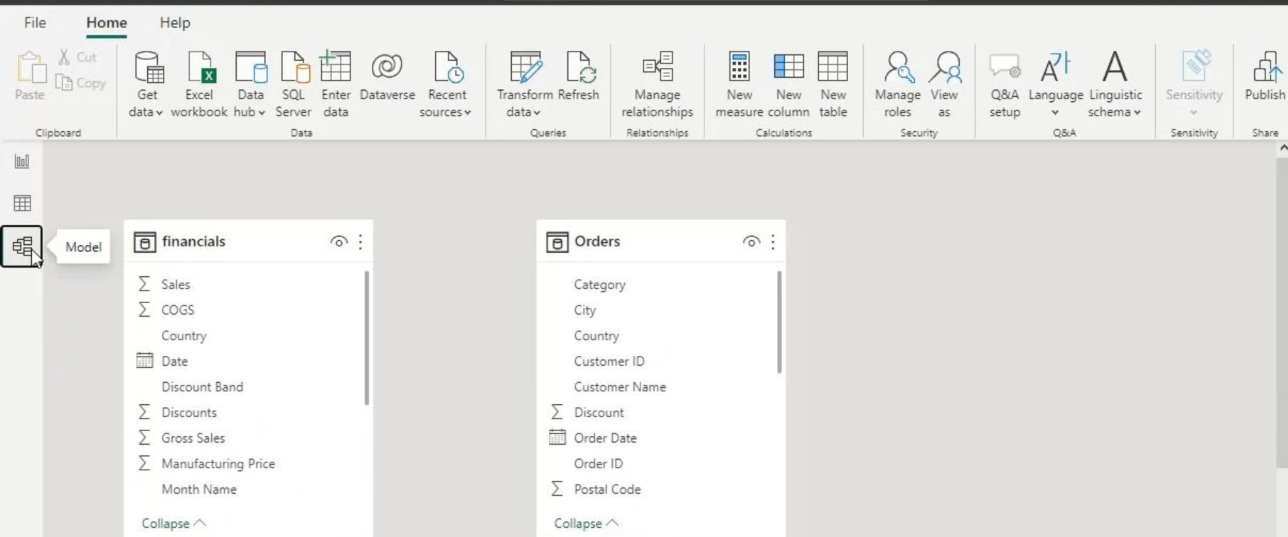
2. Power Pivot: Building Relationships for Deeper Insights
Power Pivot is your data sculptor. It allows you to shape your data for optimal analysis:
- Model View: This is where Power Pivot comes alive. If you have multiple data sources (e.g., various spreadsheets), you can combine and transform them here.
- Building Relationships: Define relationships between different datasets to create a cohesive data model. This ensures your visualizations accurately reflect the connections between your data points.
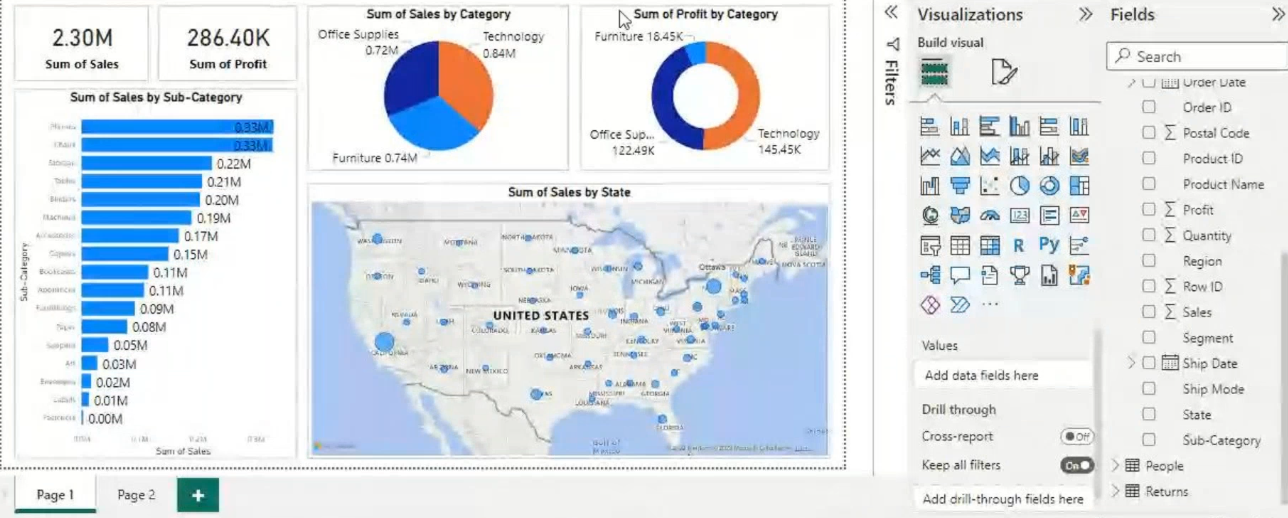
3. Power View: Crafting Compelling Visualizations
Power View is your data storyteller. Here’s how to turn your data into impactful visuals:
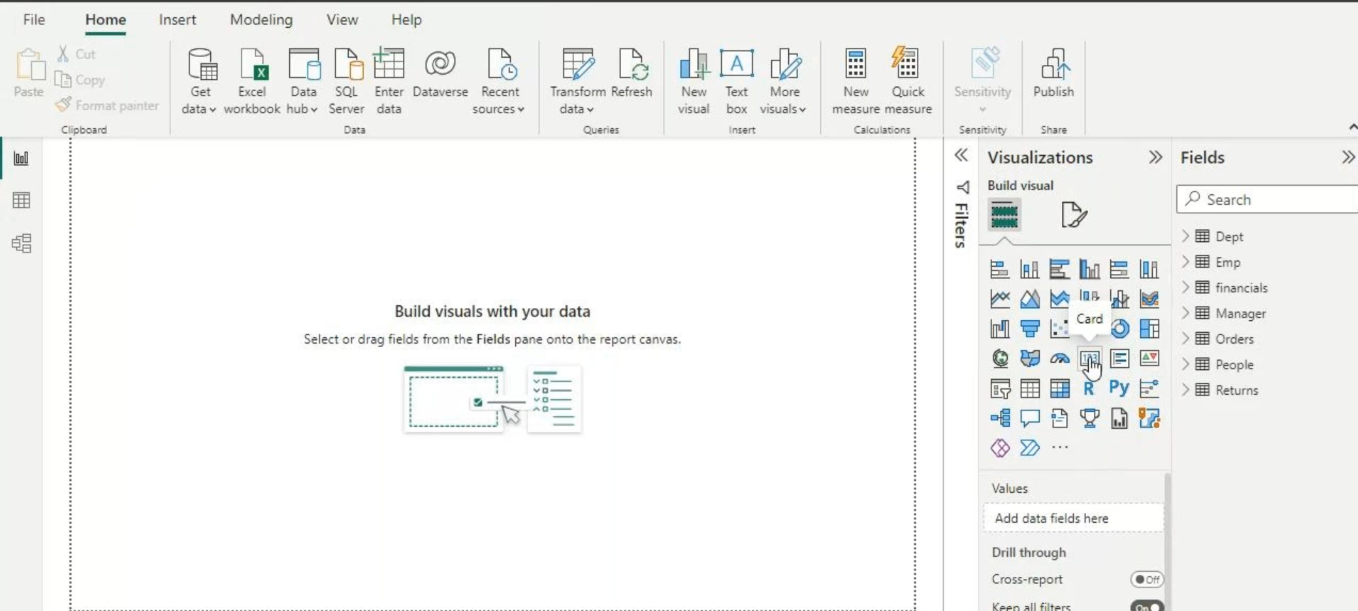
- Visualization Powerhouse: Once your data model is set in Power Pivot, unleash your creativity in Power View. Craft charts, graphs, and other visuals that effectively communicate your insights.
- Saving and Sharing: Save your report for easy access within your organization.
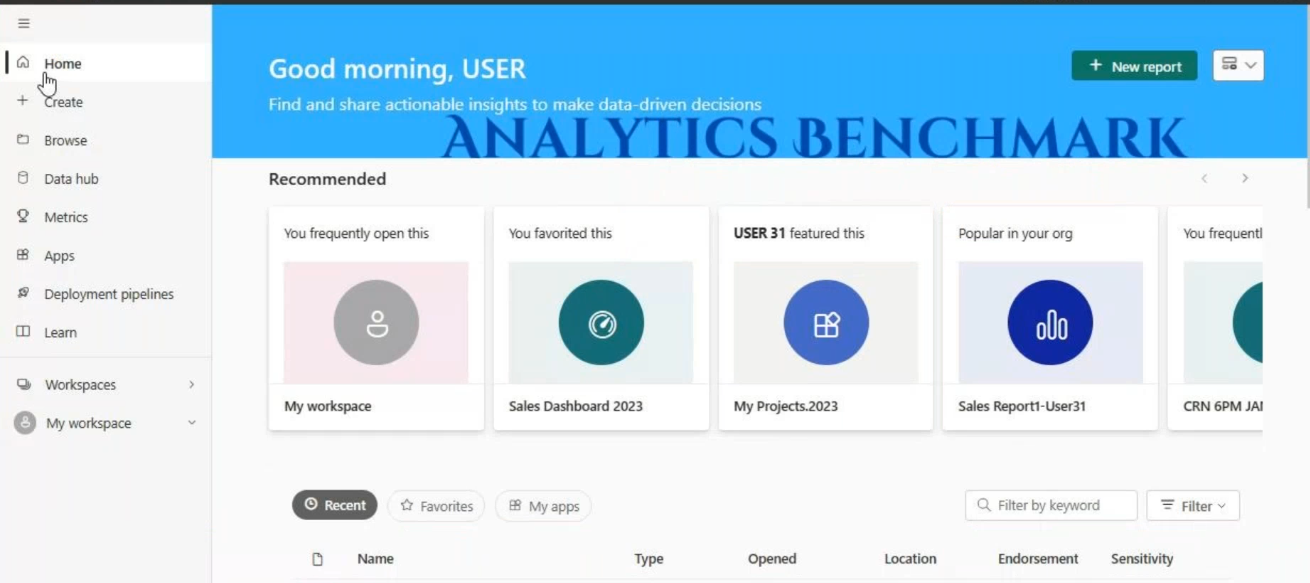
Sharing Insights Securely with Power BI Services
To share your reports with managers or clients, leverage Power BI Services:
- Sign in to Power BI Services (https://app.powerbi.com/): This online platform empowers you with administrative controls.
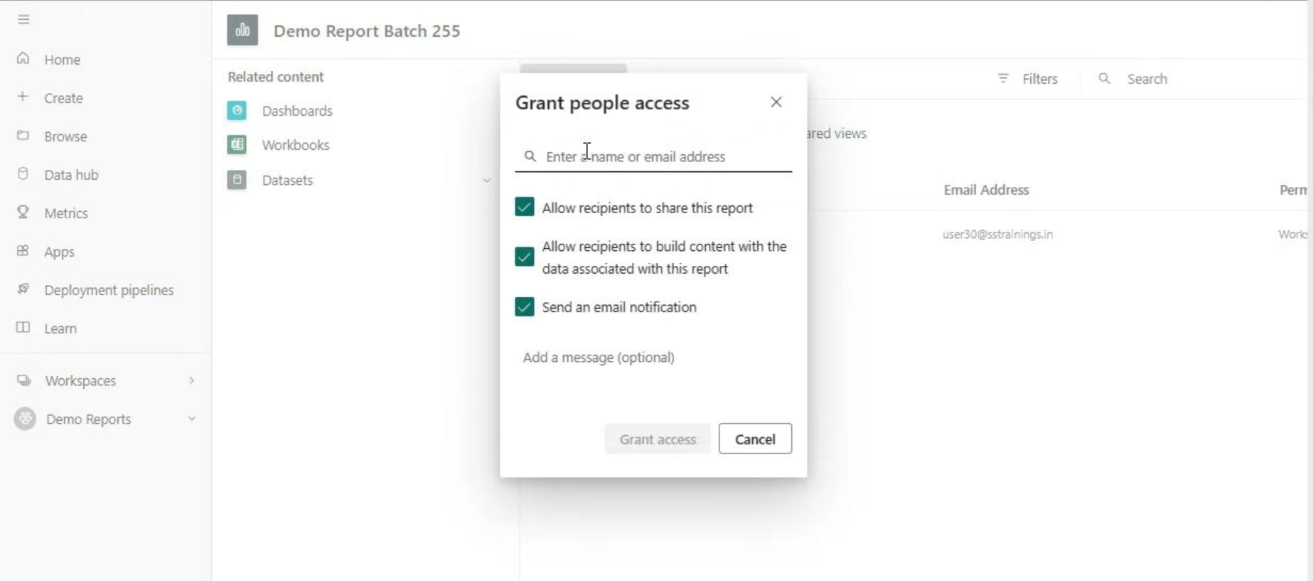
- Granting Permissions: Navigate to “Reports,” select your report, and click “Manage Permissions.” Under “Direct Access,” add new users and grant them access as needed.
Empower Informed Decisions with Power BI
With Power BI, you hold the key to unlocking valuable insights from your data. By mastering Power Query, Power Pivot, and Power View, you can transform data into a compelling narrative, driving informed decision-making within your organization.